Business infographics are a great way to present a lot of information in a visually appealing way.
You can show a step-by-step process, highlight findings from a recent study, or even promote your content on Pinterest and LinkedIn to build traffic sources for your website.
Internet users prefer to consume information visually (images, videos, infographics, gifs, etc.) than text. Here’s a fun stat: readers are 30 times more likely to read an infographic than a written article.
Even businesses are taking infographics seriously, as 60% of them are already putting out business infographics. The popularity of the term “how to create infographics” is clear proof of that.

We have compiled a list of some of the best business infographic examples from which you can take inspiration and start creating your own.
So, let’s get started.
List of the Top Infographic Design Examples
Infographics for business must be used in a particular context. You must know what you want to convey via a business infographic. Are you trying to explain a process, or do you want to present findings from an internal survey or something else.
Here are some of the best infographic ideas that the best in the business are doing, and you can do them, too.
1. Spot Cafe Revolutionizes the Traditional Menu Norms

Infographics do not always need to be about charts and graphs; they can be personalized with hand-drawn illustrations like Spot Cafe has done with their menu.
Spot Cafe brilliantly uses infographics to resemble what the food looks like. When customers see the food item they are ordering, it encourages them to order more. The menu uses clear text within graphic elements for descriptions and price tags to maintain a visual balance with the diagrams.
⭐What do we like about this infographic?
- The infographic is friendly and welcoming, adding to the customer experience.
- The shades of brown and off-white colors maintain consistency across the infographic and do not overwhelm the customer.
- The hand-drawn diagrams add a personalized touch to the menu, which is essential for a food business.
Old menus look boring and do not add anything to the customer experience; that’s why you should tell your print design company to design a modern menu with images, illustrations, and bold, visible fonts like this one.
Also read: Best Business Fonts to Use
2. UNICEF Shows How to Visualize Data With Charts and Graphs

From time to time, UNICEF releases reports on factors affecting children and their rights. In this report, the organization shows, with the help of illustrations and graphs, the inability of parents to fulfill family responsibilities due to long working hours.
The infographic keeps the text minimum and uses flags as dots to represent the surveyed countries. With one quick glance, you can understand all the useful information that this infographic wants to convey.
⭐ What do we like about this infographic?
- The infographic chooses on-brand colors to maintain brand consistency.
- Information design mainly includes charts, graphs, and numbers; this infographic tells you how to do it right.
- Using a scale to show how people balance their lives between work and family connects with the report’s target audience.
Simple graphs, colorful illustrations, and minimal text help you maintain design consistency. This is a perfect combination for user-centered designs like business infographics.
3. DesignMantic Uses Color Palette to Offer Choices

A business infographic can be used to display multiple options; however, you can quickly mess it up by overwhelming the reader. That’s why DesignMantic shows us how to use a color palette to organize and present a lot of information in a visually appealing way.
⭐ What do we like about this infographic?
- Colorful infographics for businesses are scroll-stoppers and boosts audience engagement.
- Such color palette-based business infographics are easy to replicate and help maintain brand consistency without a lot of effort.
You can create templates of such color palette-based infographics to showcase your store’s inventory, offer services, and even summarize your blog posts.
4. Show a Step-by-Step Process Like Instamojo Does

A single business infographic is enough to summarise a 3000-word blog post, and Instamojo shows you how to do it. The illustrations perfectly complement the process, and the timeline establishes the sequence the reader must follow.
⭐ What do we like about this infographic?
- It perfectly encapsulates the steps you need to follow without overwhelming you with too much text or other info.
- Designing a business infographic is a part of marketing design, and such infographics are great for social media marketing on platforms like LinkedIn and Pinterest.
You can use such flowchart-based infographics to summarize a process or show a customer journey. You can even summarize your how-to articles for visual storytelling.
5. Make It Interactive As the Beatles Do

Infographics for business do not have to be flat. They can be interactive, like this one designed by DuelingData that tells you the Beatles’ biggest hits. It lets you change the data according to your selected criteria – all songs, top 100 songs, and number 1 hits.
⭐ What do we like about this infographic?
- Adding interactive elements like dropdowns, playable gifs, and color selections boosts audience engagement.
- The combination of various colors, musical notes, a branch-like design, and logos representing the band members makes the infographic come alive.
You can use such interactive business elements to boost your website’s UI/UX experience or display statistics that users can customize according to their requirements. Creating such interactive infographics might be a bit difficult, so why not let the experts handle it? Hire a design agency like Duck Design, which offers custom infographics and illustration services at super-affordable rates.
Learn More!

The University of Southern California analyzed the US millennial population and helped businesses understand their psychology and how to market to them. The survey’s results were presented in a colorful infographic with numbers, charts, bar graphs, and personalized illustrations.
⭐ What do we like about this infographic?
- Showing statistics always comes with the risk of overwhelming the readers, but USC does it perfectly with calm colors, custom illustrations, and multi-size font.
- Small touches like a young man popping out of the word MILLENNIALS add a little fun to a rather serious topic.
If you are a marketing agency, you can create such infographics to provide valuable information to your audience on social media platforms. You can even use such infographics to show the results of a survey.
If you struggle to create such an information-focused infographic, you can always outsource graphic design to an expert like Duck Design.
7. Office Timeline Shows How to Condense History

One of the most common business infographics that you will always see is a timeline infographic. It tries to show the history of a company, a product, a person, or an event in a condensed manner.
For example, this infographic, designed by Office Timeline, shows the history of the popular Apple product iPhone, from its launch to its latest variant.
⭐ What do we like about this infographic?
- Sticking to a color or shades of a color is important in timeline infographics, and this infographic does it perfectly.
- The minimal text (only variant name and launch date) lets the reader focus more on the timeline.
As a business, you can use such timeline infographics for data visualization in PPTs to demonstrate a product’s backstory or an event. This way, you can display milestones you have achieved or plan to achieve.
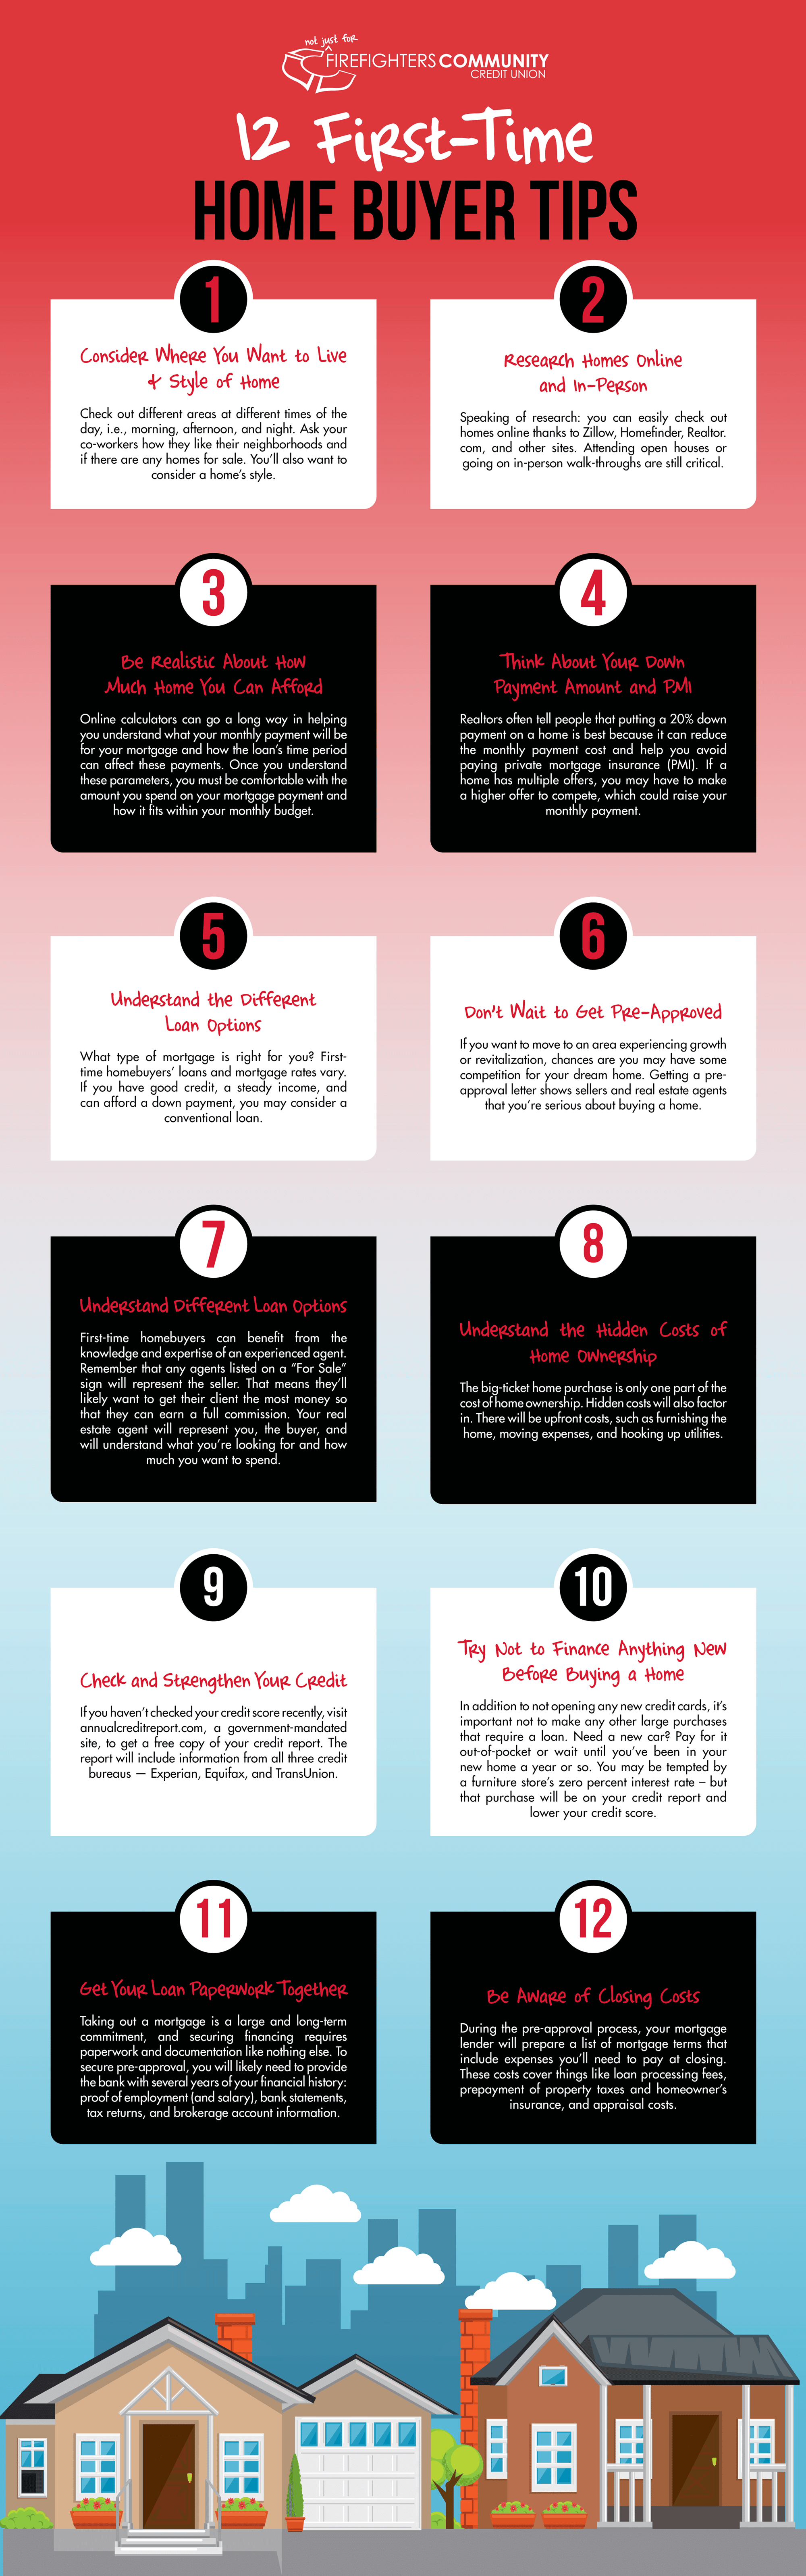
If you have a listicle to share with your audience, a list-focused infographic is a great alternative to writing a 4000-word listicle. In this infographic, Firefighter Community Credit Union shares 12 tips for first-time home buyers.
⭐ What do we like about this infographic?
- This infographic makes it easy to consume the information with individual bubbles for each tip.
- Colorful illustrations and icons add a little cheerfulness to the infographic.
- The spacing between the bubbles and the color contrast looks easy on the eyes.
You can create such list-based infographics to share tips, ideas, mistakes to avoid, and solutions. On the other hand, summarize your listicle in an infographic like this and share it on social media platforms for initial traction.
We have curated a list of some of the best illustration agencies that can create amazing custom illustrations for your business infographic.
9. Leverage Compares Popular Social Media Platforms

Comparison infographics help you pit two or more parameters against each other. In this infographic, Leverage compares the most popular social media platforms in 2022. They use on-brand colors and consistent fonts to establish the distinction without making a mess.
⭐ What do we like about this infographic?
- While comparing, you should use one color for one parameter. This helps create a clear distinction, as you see in this infographic.
- Leverage stays consistent with the font sizes and only mentions what is essential.
- Adding some illustrations (logo, map, people, etc.) helps to hold the user’s attention.
You can use comparison infographics to compare key metrics, platforms, people, companies, and periods (Q1 vs Q2).
10. Semrush Explains How a Marketing Funnel Works

In our opinion, Semrush is one of the best in the business when it comes to creating editorial infographics. Each year, they publish their online marketing reports, which contain amazing explanatory infographics that help you understand complex information in seconds.
⭐ What do we like about this infographic?
- Explains the flow of a marketing funnel in the simplest way.
- The icons help people relate to the diagram, and the arrows help them understand the direction of the funnel.
- Semrush just mentions the name of the funnel stage, maintaining simplicity.
If you write informational blog posts on your website, you can use such informational infographics to complement the blog post and engage your audience better. Just make sure you incorporate your own graphic design style into the infographics.
Get in Touch Now!
11. CB Insights Shows How to Incorporate Geography into Your Infographics

If you want to show data covering a wide geographical area, CB Insights shows you how to do it right. Use vibrant colors and a scale-based color system to create a clear picture of what you want to show.
⭐ What do we like about this infographic?
- The scale-based system adds a touch of uniformity to this business infographic.
- The addition of company logos certainly locks attention.
Businesses can use such map-based infographics for market analysis, sales territory planning, consumer behavior insights, risk assessment, and even performance tracking.
The Impact of a Properly Made Business Infographics
Quality infographics have a positive effect on businesses. They boost communication and engagement. As attention spans decrease, infographics play a key role in content marketing. They give a lot of info in a quick look.
Here’s how good business infographics help:
- More Engagement: People like and share infographics three times more than other content on social media. This leads to more brand visibility and interaction. Search Logistics says posts with infographics get 650% more engagement than the ones without.
- Improved Retention: Infographics help people remember information better. Visme reports that readers can retain 65% of the info when it comes with a related image.
- Higher Read Rates: People are 30 times more likely to read infographics from start to finish compared to regular articles. This gives companies more chances to communicate their message effectively and build a strong relationship with the audience.
- Boosting Traffic: You can adapt infographics for use on various social media platforms, which will help you create multiple ways to bring visitors to your website. Adding infographics can boost website traffic by up to 12%, which is key in attracting potential customers and increasing sales.
- Better Learning: Infographics boost learning results by up to 400%, making them perfect for educational content and training materials.
A business needs graphic design, not just for good visuals but also for a smart plan to connect with its audience.
This is why splurging a little on well-made infographics boosts user interest, helps people remember information better, and brings in more traffic. These factors make infographics a key part of any marketing plan.
Benefits of Ordering Infographics Design Services from Agency
Graphic design agencies focus on making visual content that explains complex ideas clearly and effectively.
These companies employ talented designers and planners who create various materials, including logos, websites, and infographics, all made to fit specific business needs and brand goals.
- Professional Quality: Design firms deliver top-notch designs that boost your brand’s image. Talented designers make sure infographics look good and match your brand’s style.
- Expertise in Data Visualization: Graphic designers and design firms are great at turning complex data into easy-to-understand visuals. This helps your audience grasp key points, leading to better retention and engagement.
- Customization: Infographic design services offer solutions tailored to your unique message and brand needs. This ensures the final product connects with your target audience.
- Save on Time: When you outsource infographic design, your team can focus on key business tasks while design pros handle the creative work. This can speed up delivery and boost your return on investment from marketing.
Responsive web design agencies like Duck Design offer personalized services and access to talented designers who understand your business and help you create eye-catching infographics.
Read Also: Best Infographic Design Agencies for Useful and Vivid Visualizations